The window to the multitude of information and data needed for city management.
Enriching the information available for decision-makers to deal with anticipated and unforeseen events and to contribute to a sustainable urban planning. Through a composite indicator, this analytical platform enables the detection of daily general variation, but also during events in the city, as well as the impact of these events on the indicator’s constituent variables.
A new way to visualize urban data…
The UDI is an innovative approach to how cities can access and analyze data. UDI is a window to the complex world of urban data, showing the dynamics of a city through a simple and easy-to-understand indicator. This composite indicator quantifies a city’s daily urban activity and serves as a gateway to the complex world of data visualization.
In today’s urban management landscape, many teams rely on numerous dashboards. While these dashboards can be powerful tools, they often prove time-consuming, reducing team efficiency. The UDI provides management teams with a straightforward and efficient means of gaining insights into a city’s dynamics. This allows teams to promptly identify unexpected changes in the city’s dynamics, which can then be examined in more detail by examining the variables used to generate the UDI. This innovative approach empowers city management teams to oversee city services efficiently and adapt swiftly to evolving circumstances.
The UDI was proposed by Porto Digital and is developed as part of several research projects, in a partnership of with NOVA Cidade – Urban Analytics Lab (NOVA Information Management School), which was the scientific partner. The UDI was initially created as a management tool for the city of Porto, in Portugal, but it can be applied to other cities as well. The UDI is based on a factor analysis of seasonally adjusted daily data, such as, traffic intensity, public transportation usage, internet usage in public buses, NO2 emissions and noise level.
·Composite indicator.
· Holistic view over city dynamics.
·High-resolution spatio-temporal indicator.
· Synergy between academia and local government.
· Understand the state of the city in real time.
Benefits
Sustainability SDG11
11th goal of the United Nations’ 2030 Agenda for Sustainable Development: Make cities and human settlements inclusive, safe, resilient, and sustainable.
Decision-making
Support short-term decision making and policy design.
Responsiveness to variations
React to crisis situations and understand how urban dynamic evolves during normal periods of activity
Zoom in at local level
Most composite indicators focus on a single phenomenon, are calculated at a country level, disregarding the variations that occur at the local level, and are mainly concerned with measuring economic activity, overlooking important phenomena of urban dynamic that play a crucial role in the city’s quality of life and sustainability.
Technical approach and research
The indicator, in this current version, is composed of several time series selected after an extensive analysis, thatcontain daily data regarding traffic intensity, public transportation usage, internet usage in public buses, NO2 emissions and city noise level.
Time Series
With the adjusted series, we proceed with a Factor Analysis model estimation to obtain the daily urban dynamic composite indicator. Factor Analysis is a technique for identifying latent variables, called factors, that drive the co-movement of observed variables.
Factor Analysis
With the adjusted series, we proceed with a Factor Analysis model estimation to obtain the daily urban dynamic composite indicator. Factor Analysis is a technique for identifying latent variables, called factors, that drive the co-movement of observed variables.
Please find addition detail in the following published papers:
Jardim, B., Neto, M. D. C., Alpalhão, N., & Calçada, P. (2022). The Daily Urban Dynamic Indicator: Gauging the urban dynamic in Porto during the COVID-19 pandemic. Sustainable Cities and Society, 79, 1-11. [103714].
Jardim, B., Neto, M. D. C., & Calçada, P. (2023). Urban dynamic in high spatiotemporal resolution: the case study of Porto. Sustainable Cities and Society, 98(November), 1-9. [104867].
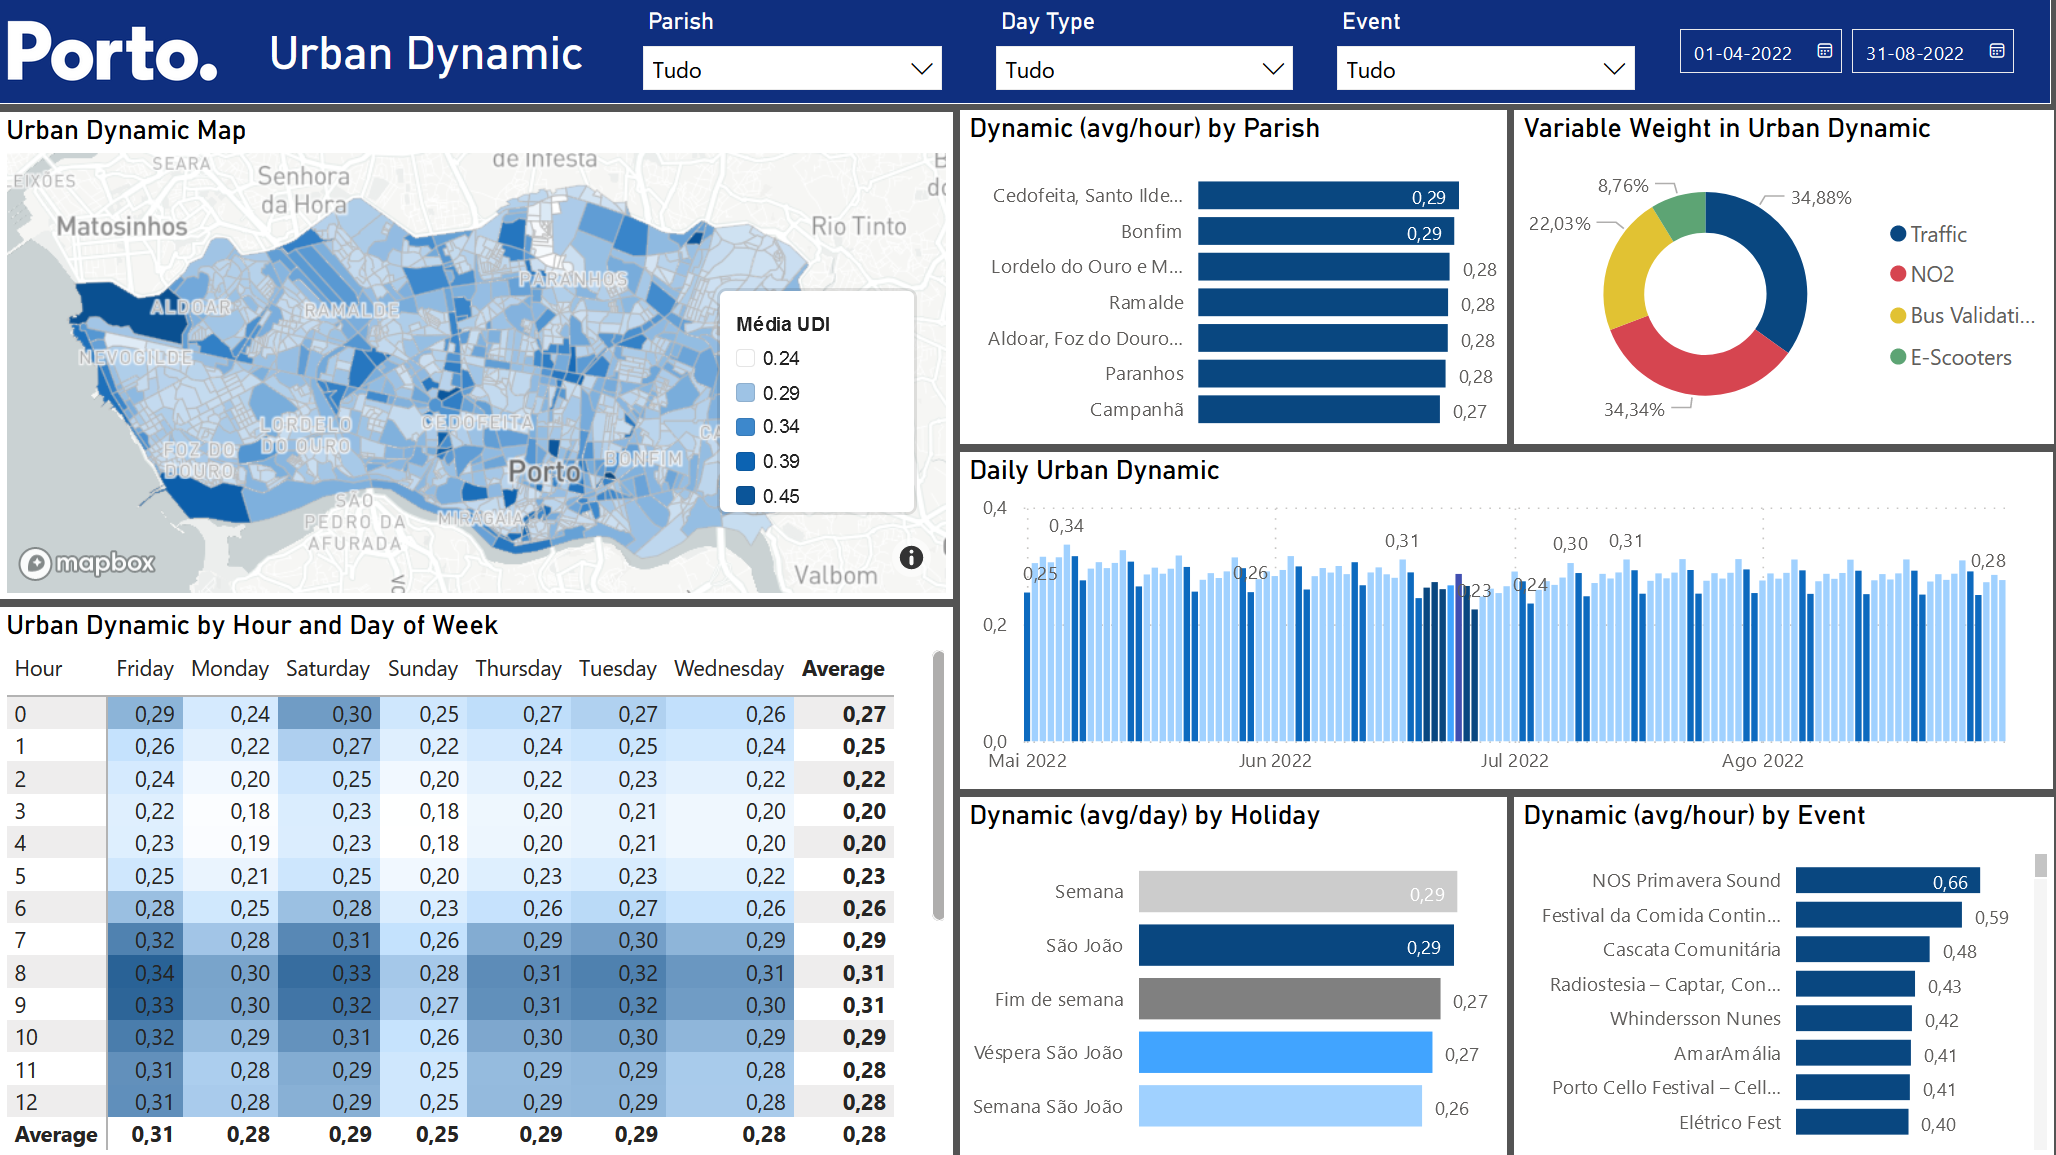
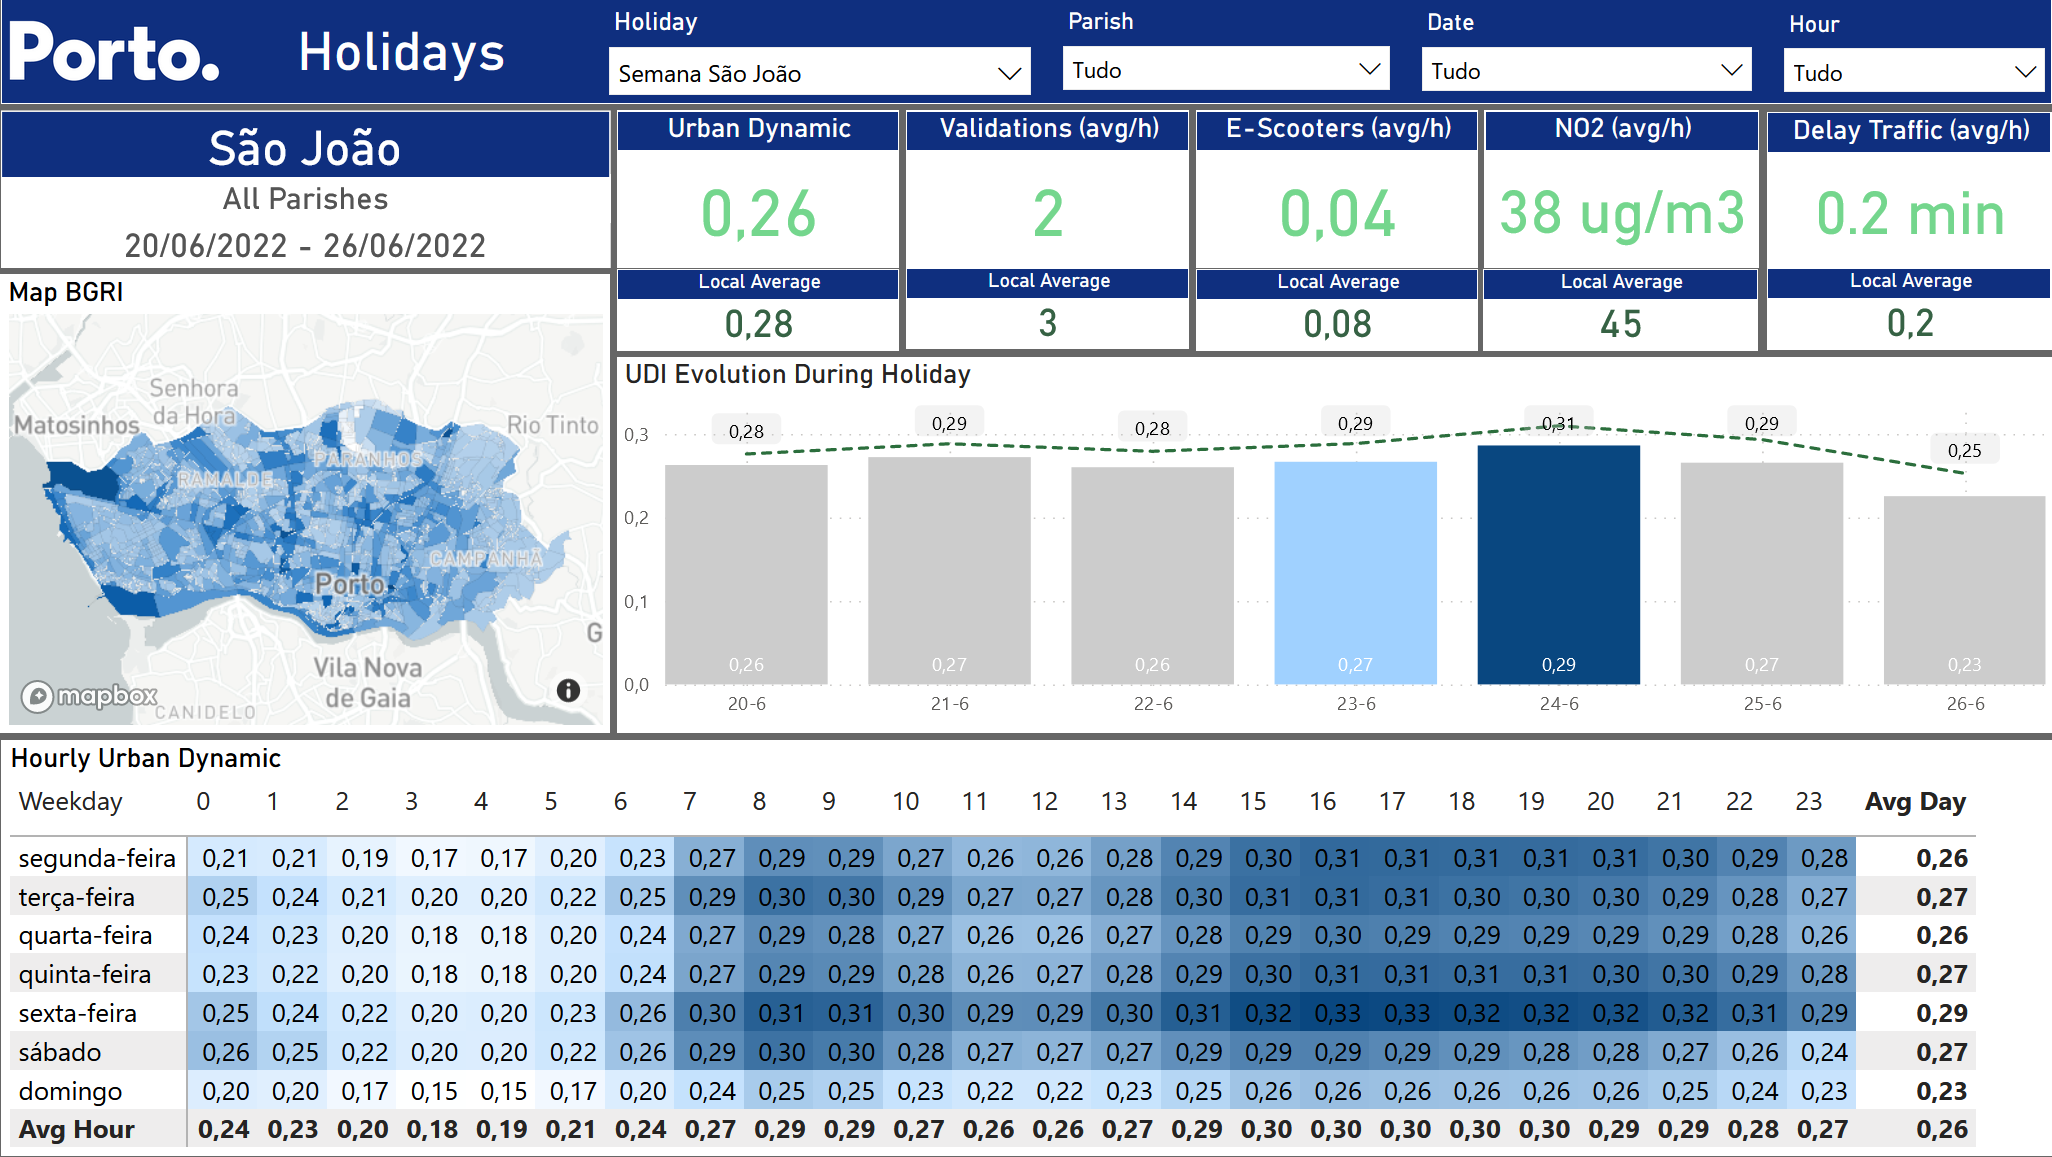
Porto’s Daily dynamic
Hourly data
Traffic
Public transport use
e-Scooter trips
Air quality (NO2 emissions and city noise level)
What’s next?
The UDI is on a path of continued growth and development. By 2024, it will receive partial funding through a new project, Acelerar e Transformar o Turismo, which aims to expand its reach to other cities from the northern region of Portugal. Originally, UDI began as part of the Data4Covid19 project and was also presented as a case study in the City Catalyst project.